Return to the Professional Development Module Index
Printer Friendly Version
Grades: 5-8
Author: Tess Ewart
View Student Lesson Plan
Module Description
As a result of the presenter-conducted module, participants will use self collected data to make line graphs. They will discuss what elements are needed to make a good graph. Participants will design a lesson that will use graphing in their classroom. Participants will discuss limitations of models to represent the real world.
The materials the presenter will need depend on the "creeping material" chosen.
For the Glop the presenter will need:
For Oobleck, the presenter will need:
Or use commercially bought Slime.
At each station, participants should have:
Engagement
Show an image of a mountain range or a fault line. One that can be found at the following web sites:
USGS - http://infotrek.er.usgs.gov/pubs/
NJESTA Website - http://www.njesta.org/
Earth Science World Image Bank - http://www.earthscienceworld.org/images/index.html
Ask the participants: "How fast are the mountains moving? How fast are Earth's tectonic plates moving? (most can be measured in centimeters per year) How do you know? How do scientists know?" (accept all answers - scientists can use sensors to take detailed measurements)
Tell the participants that, "Scientists have to keep accurate data over time. They usually represent this data in graphs to convey their ideas to other people."
Ask the participants: "Why is it important for students to be able to read graphs effectively? (reading graphs effectively will improve the students' scientific literacy) What is the best way to have students work on this skill?" (The best way to improve the students' skills is to construct graphs of their own)
Discuss with the participants why it is important to have experiments repeated several times. (Repeating experiments several times ensures the validity of the results and conclusions)
Tell the participants that, "Scientists also use models to represent their ideas." Participants will now use a model to represent a type of slow mass wasting called creep.
Assessment: Participant discussion
Exploration
Assessment: Completed participant answer sheets
Explanation
Ask the participants, "What type of graph would be best to use for the data you just created? Why?" (A line graph would be best because it shows movement over time of the material.)
Have the participants create a graph for their data giving little guidance. When finished, have the participants share the graphs they created. Ask the participants, "What is similar about the graphs? What is different? (accept all answers) What makes a good graph?" (Every graph should contain the following elements: a title, labeled axes with the appropriate units in parentheses, axes that start at the origin (0,0), numbered axes in regular intervals (but it does not have to go by ones and the two axes do not have to increase by the same interval), and provide a key if you have more than one line.) The Dalton School: Graphing Guidelines - http://intranet.dalton.org/departments/Science/Biology1/graph_guidelines.html
Tell the participants, "Sometimes, scientists also use models to convey their ideas to people. These models have their limitations and do not totally represent what is occurring in real life. For example, a candy bar can be used to illustrate the movement of tectonic plates on Earth's asthenosphere. The movement of the "tectonic plates" in the candy bar is made by the person holding the bar while the motion of the tectonic plates in Earth is due to the convection currents within the asthenosphere." The limitations of models should be discussed with participants.
Assessment: Completed graphs and discussion
Elaboration
Ask the participants, "What do the graphs show about creep? (As the angle of repose [height of the board] increases, the material should flow faster.) What does this mean for hill sides? (The steeper the hill side, the more likely material will flow, the faster it will flow.) What would be some real life situations where creep would be an issue?" (accept all answers)
Make sure you stress to participants that while each group is doing one trial at different elevations, by having the whole group do the same three elevations, this would constitute repeated trials.
Have participants predict what would happen to the graph if the viscosity (thickness) of the material changes. Have participants predict what would happen to toothpicks that are placed in a straight line across the material. Participants should give their reasons behind their ideas. If enough time, have participants explore their ideas.
Assessment: Application of model to real life situations, graph predictions
Classroom Implementation:
From: National Science Standards A Grades 5-8:
The instructional activities of a scientific inquiry should involve students in establishing and refining the methods, materials, and data they will collect. As students conduct investigations and make observations, they should consider questions such as "What data will answer the question?" and "What are the best observations or measurements to make?" Students should be encouraged to repeat data-collection procedures and to share data among groups.
In middle schools, students produce oral or written reports that present the results of their inquiries. Such reports and discussions should be a frequent occurrence in science programs. Students' discussions should center on questions, such as "How should we organize the data to present the clearest answer to our question?" or "How should we organize the evidence to present the strongest explanation?" Out of the discussions about the range of ideas, the background knowledge claims, and the data, the opportunity arises for learners to shape their experiences about the practice of science and the rules of scientific thinking and knowing.
The language and practices evident in the classroom are an important element of doing inquiries. Students need opportunities to present their abilities and understanding and to use the knowledge and language of science to communicate scientific explanations and ideas.
Mathematics is essential to asking and answering questions about the natural world. Mathematics can be used to ask questions; to gather, organize, and present data; and to structure convincing explanations.
NSES CONTENT STANDARD D: As a result of their activities in grades 5-8, all students should develop an understanding of the following Earth and Space Science topics:
NSES CONTENT STANDARD A: As a result of activities in grades 5-8, all students should develop an understanding of the following Science as Inquiry topics:
NSES PROFESSIONAL DEVELOPMENT STANDARD A: Professional development for teachers of science requires learning essential science content through the perspectives and methods of inquiry. Science learning experiences for teachers must:
NSES PROFESSIONAL DEVELOPMENT STANDARD B: Professional development for teachers of science requires integrating knowledge of science, learning, pedagogy, and students; it also requires applying that knowledge to science teaching. Learning experiences for teachers of science must:
1-2 hours
Notify the participants in advance to bring their curriculum guide/map or textbook to facilitate their development of an implementation plan.
Prepare "creeping material" according to the following:
Directions for "Glop"
Directions for "Oobleck"
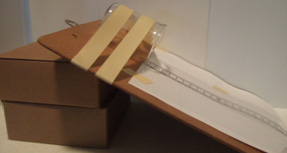
Exploration materials setup for each lab station:
Safety considerations will depend on the "creeping material" the presenter chooses to use.
The glop mixture contains Borax which is poisonous if ingested. If this material is accidentally eaten, call the poison control center immediately.
Borax is also an eye irritant. Eyes that may have been contaminated with glop should be flushed with water immediately. See Flinn Scientific website (www.flinnsci.org) for MSDS.
Students should be cautioned before task and instructed to wash their hands after completing the task.
Be careful.
Teachers and students should always exercise appropriate safety precautions and utilize appropriate laboratory safety procedures and equipment when working on science performance tasks.
Assessments can be found at the end of each learning cycle stage.
Have the participants "solve" the problems illustrated by the graphs from the following web sites:
NGfL: The Pet Graph - http://nrich.maths.org/public/viewer.php?obj_id=247
Cynthia Lanius: The Hot Tub Lesson Plan - http://math.rice.edu/~lanius/Algebra/hottub.html
Mass wasting is the name for all of Earth's processes by which gravity pulls materials down. Some of the processes, like landslides and avalanches, are rapid, while others, like soil creeping, occur so slowly that observations are difficult to obtain. Additional content information appears in the body of the module.
If the presenter would like to have participants explore computer graphing skills, see the lesson at https://uakron.edu/polymer/agpa-k12outreach/professional-development-modules/using-current-data-for-graphing-skills
Download Lesson Implementation Template: Word Document or PDF File
Issues to consider are the following: seating so everyone can see the display and graphs, make sure every person participates in discussions and exploration, and grouping with diversity in mind.
Adapted from PALS - http://pals.sri.com/tasks/5-8/Creeping/
The focus of this module is graphing using a model of creep or mass wasting as a way of collecting data.
Adapted from PALS - http://pals.sri.com/tasks/5-8/Creeping/
