
Return to Lesson Plan Index
Printer Friendly Version
Grades: 12
Author: Jake Saylor
Source: This material is based upon work supported by the National Science Foundation under Grant No. EEC-1161732.
Students will determine the coefficient of kinetic and static friction for various tires such as tractor, truck, bike, high performance, tourism. They will then have to apply this knowledge to solve a practical problem.
What should students know as a result of this lesson?
What should the students be able to do as a result of this lesson?
Various rubbers or tires (one for each group), force sensors and computers, various masses, ramp. My suggestion would be to get one bike, tractor, truck, high performance, and tourism tire.
If tire samples are not available a number other materials can be used. Students could remove one of their shoes, which likely have rubber soles, and use that as the test sample. A second option is to glue various rubbers or plastics, like from a bottle, plastic bag, erasers, bubble wrap, or plastic wrap to the bottom of wood block. Commercial rubber band could also be wrapped around a wood block to make a rubber surface.
Instructor Setup: The students will be collecting data through the force sensors so they will need to have the proper interface/computer program to do so. In addition they will need to have access to some type of graphing program such as Logger Pro or Graphical Analysis. The students will also need to have access to various masses so they can change the normal force on the tire.
Engagement/Assessment
What variables affect the amount of friction between the tire and the road? Possibly things such as surface area, speed, and normal force?
Exploration/Assessment
Students will perform a lab using force sensors to measure the peak static and kinetic friction to determine how the normal force impacts friction. They will then graph the fiction force as a function of normal force.
Explanation/Assessment
Students will plot their data using Logger Pro/Graphical Analysis and derive an equation for friction and determine the coefficient of friction for their surfaces. The class will share their data for what they got for the coefficient of friction for the various tires.
Elaboration/Assessment
Students will complete an application problem with their group to determine at what angle their tire sample will start to slide down the hill.
The students should have already studied Newton's 1st and 2nd laws and have a good idea how unbalanced forces relate to motion. They should understand the fundamental forces and be able to draw a force diagram. For the practical application problem they should know how to break forces into their x and y components.
NGSS Standards:
Common Core Standards:
National Standards:
Ohio Standards:
Physics Content Knowledge: Coefficient of friction for different surfaces, friction equation and friction calculations.
Technology Content Knowledge: how to set up and use probes and sensors to collect data, how to plot and analyze data using logger pro/graphical analysis.
None.
In tire production and applications of different tires for different vehicles/terrain.
Lab data, questions, and practical application problem.
Grouping Suggestions I would suggest giving each group a different tire/rubber and then comparing class data so the students can see the differences in the amount of friction.
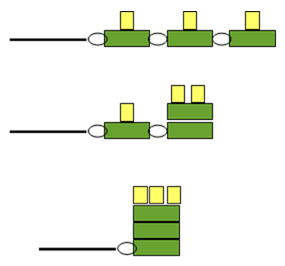
Instructor Demonstration: If the students suggest things such as surface area and speed as variables that affect friction the easiest way to test these is through a class demonstration (but you may want to have the groups test these themselves). To test surface area hook 3 wood blocks together other and pull them with a force probe and then change it to three blocks stacked on top of each other and compare the friction force. The whole time you must keeep the same normal force so be sure not to change the mass of the system. A picture of this is shown below:
Pacing/Suggested Time: Depending upon how good the students are at using logger pro/graphical analysis to plot data this lesson will take a minimum of 1 hour up to 1.5 hours.
