

Retention and completion statistics | Fall 2018
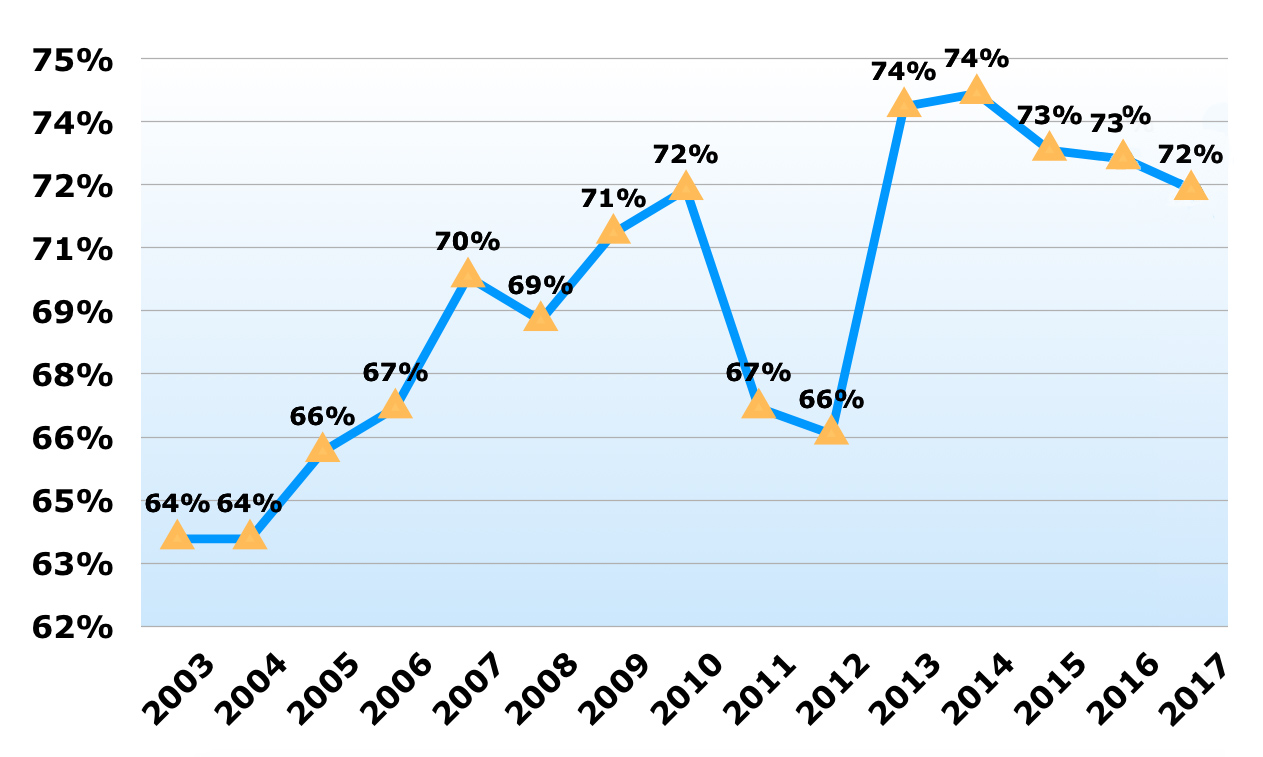
First Year Retention Rate, 2003-2018
First-time Full-time Akron Campus Bachelor Degree Seeking Cohort
Cohort Retention Rates by Year
First-time Full-time Akron Campus Bachelor Degree Seeking Cohort
Fall Term |
Cohort |
Retention Rates |
||
| Cohort Class Year | Class Size | Year 1 | Year 2 | Year 3 |
| 2010 | 3,374 | 71.9% | 57.5% |
51.2% |
| 2011 | 3,275 | 67.0% | 54.7% | 48.9% |
| 2012 | 3,074 | 66.4% | 56.0% | 49.6% |
| 2013 | 2,722 | 73.9% | 61.6% | 54.8% |
| 2014 | 2,939 | 74.2% | 62.5% | 56.6% |
| 2015 | 3,179 | 72.9% | 63.3% | 57.1% |
| 2016 | 2,479 | 72.7% | 61.5% | |
| 2017 | 2,874 | 71.9% | ||
| 2018 | 2,598 | |||
4-yr, 5-yr and 6-yr graduation rates
First-time Full-time Akron Campus Bachelor Degree Seeking Cohort
Fall Term |
Adjusted Cohort |
Graduation Rates |
||
| Cohort Class Year | Class Size | 4-yr | 5-yr | 6-yr |
| 2005 | 2,840 | 14.0% | 31.0% |
38.0% |
| 2006 | 3,316 | 14.7% | 32.9% | 39.6% |
| 2007 | 3,552 | 15.6% | 33.6% | 40.2% |
| 2008 | 3,550 | 14.3% | 33.7% | 40.6% |
| 2009 | 3,723 | 13.5% | 33.2% | 39.9% |
| 2010 | 3,370 | 16.2% | 36.6% | 42.8% |
| 2011 | 3,269 | 17.3% | 37.5% | 43.1% |
| 2012 | 3,068 | 19.3% | 39.0% | |
| 2013 | 2,715 | 24.9% | ||
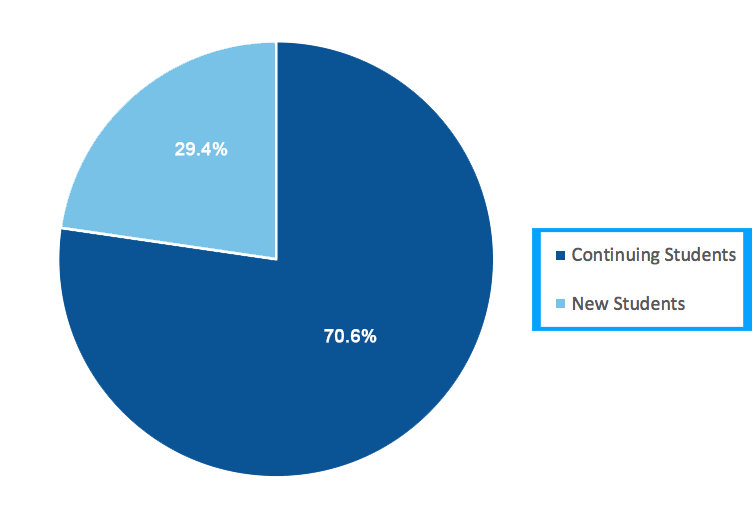
Fall 2018 undergraduate student enrollment
Finish in time
First-time Full-time Akron Campus Bachelor Degree Seeking Cohort
College of Major |
2014 |
2015 |
2016 |
2017 |
2018 |
| Buchtel College of Arts & Science | 72.6% | 76.9% | 70.2% | 67.3% | 71.1% |
| College of Applied Science & Technology | 61.5% | 68.9% | 80.6% |
72.8% |
77.4% |
| College of Business Administration | 81.7% | 79.5% | 79.2% | 72.4% | 85.3% |
| College of Health Professions | 70.6% | 70.6% | 64.0% | 62.1% | 51.5% |
| College of Education | 74.6% | 75.2% | 66.3% | 70.9% | 72.3% |
| College of Engineering | 57.2% | 71.1% | 61.8% | 47.5% | 45.7% |
| Exploratory | 80.0% | 72.5% | 57.4% | 53.8% | 48.7% |
| Overall | 68.8% | 74.0% | 67.3% | 61.1% | 61.9% |
Retention by pathway
First-time Full-time Akron Campus Bachelor Degree Seeking Cohort
Pathway |
2011 |
2012 |
2013 |
2014 |
2015 |
2016 |
2017 |
| Direct | 81.7% | 83.3% | 82.4% |
83.7% |
82.2% |
81.9% |
84.5% |
| College-ready | 68.1% | 64.7% | 75.3% | 71.1% | 72.4% | 72.4% | 69.7% |
| Emergent | 56.4% | 53.8% | 63.7% | 58.4% | 54.3% | 54.5% | 45.9% |
| Preparatory | 53.0% | 54.8% | 57.1% | 60.0% | 50.0% | 54.7% | |
| Non-traditional | 45.2% | 34.5% | 30.3% | 50.0% | 61.8% | 61.4% | 52.9% |
Retention 1st to 2nd Year
First-time Full-time Akron Campus Bachelor Degree Seeking Cohort
2011 |
2012 |
2013 |
2014 |
2015 |
2016 |
2017 |
|
| All freshman | 66.7% | 66.4% | 73.9% |
74.2% |
72.9% |
72.7% |
71.9% |
| Minority* | 56.1% | 48.8% | 63.9% | 60.2% | 61.2% | 60.6% | 62.3% |
| African American male | 42.9% | 40.6% | 56.0% | 48.9% | 57.8% | 56.1% | 54.9% |
| PELL eligible | 61.0% | 58.1% | 67.5% | 64.0% | 63.6% | 64.0% | 61.4% |
| First generation | 61.7% | 57.7% | 66.6% | 65.1% | 68.7% | 64.4% | 64.1% |